Every data center. Operating, planned, permitted, pitched.
Every US data center — rumored, proposed, permitted, or operating.
Free forever, no card · 14-day Pro trial, cancel anytime · $0 due today
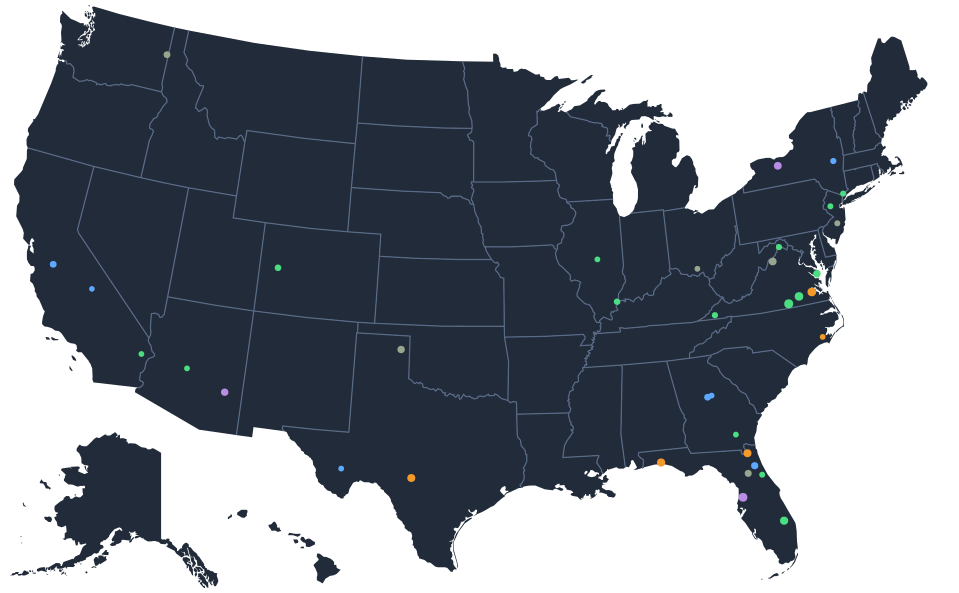
Click any state to see what's building.
Illustrative — production data refreshes nightly from primary sources (SEC filings, ISO queues, county permits, utility filings).
Power and water, as disclosed.
Two questions bring most people here: how much power will it draw, and how much water will it use. For most facilities, nobody has published it — and the numbers in circulation are often estimates repeated until they sound like facts. Gridwatch publishes what is on the record, labels how confident we are, and says plainly when a figure is unknown.
This is not a coverage gap. It is the state of public disclosure. A data center's power draw is not automatically a public number — it becomes one when a utility files it, a regulator requires it, or the operator chooses to publish it. Where that has not happened, we leave the field empty rather than fill it with an estimate.
The consequence is visible everywhere on this site. Virginia has 164 tracked facilities and 5 disclosed capacity figures. Any total we showed for Virginia would be a floor, not a measure — so we show it as a floor, and we tell you how many facilities are behind it.
Where a power number comes from
Florida is not in an ISO or RTO, so there is no interconnection queue to read. A megawatt figure enters the registry only from a primary record:
- A professional-engineer certification filed with the county property appraiser.
- A Public Service Commission filing — ten-year site plans, large-load studies.
- A DEP air permit, where on-site generation is involved — a proxy, and labeled as one.
- A first-party disclosure by the operator or the utility.
If none of those exist, the field is null. We do not carry a figure from a directory, a press release, or a developer's projection into a field that reads as fact.
What the confidence labels mean
Every water figure in the registry carries one of three labels. They are not decoration; they are the schema.
- Disclosed
- From a filing, permit, or first-party publication. We can show you the document.
- Estimated
- Derived — from cooling type, permitted withdrawal, or facility size — and labeled as a derivation, never a measurement.
- Unknown
- No figure is on the record. This is the default, and it is the most common.
A registry that never says “unknown” is not being careful with you.
Water disclosure is about to get more visible
Most facilities disclose nothing about water. Where a figure exists, it traces to a filing — most often a consumptive use permit, the public authorization required to withdraw groundwater or surface water in Florida. Permits are issued by the Department of Environmental Protection and the five water management districts, and they are public records.
Florida's Chapter 2026-65 establishes a distinct consumptive use permit process for large-scale data centers, allows the districts and DEP to require reclaimed water as a condition of approval, and specifies that a permit modification for a large-scale data center must be treated as a new initial application rather than an amendment to an existing one. It also requires every public utility to file a large-load tariff with the Public Service Commission by October 1, 2026.
The practical effect is that the largest facilities are becoming individually identifiable in the public record — by permit, by tariff, by filing. That is the record Gridwatch reads.
This is the whole method, applied to the two numbers people care about most. What counts as a data center → How we verify →
The whole pipeline,
not just a map.
Sourced & cited
Every facility traces back to its primary source: SEC filings, ISO queues, county permits, utility tariffs, press releases. No data without provenance.
Status laddering
Watch projects move: rumored → proposed → permitted → under construction → operating. Every state change emails your watchlist subscribers.
Florida-first
107 FL facilities tracked across all 67 counties — every county portal, FPL load study, FL PSC docket. The deepest public dataset on Florida's buildout.
Track the buildout, as it happens.
County officials deny application for 2,000-acre data center campus in Virginia
Dulles South gets cold shoulder weeks after QTS drops PW Gateway application
Plans for data center submitted in Mifflin County, Pennsylvania, just two days before local moratorium vote
Developer claims the site will create up to 230 construction jobs
Meta expands data center campus in Richland Parish, Louisiana, to 5GW & $50bn
Company will also invest $1bn in local infrastructure improvements
Simple. Pick a tier.
Free
- Browse the full map — search, filter, sort
- City-level location, operator, status
- Capacity buckets (S/M/L/Hyperscale)
- 5 detail views per month
Pro
- Everything in Free, plus:
- Exact address, coordinates, and MW
- Full source & provenance on every facility
- Unlimited detail views, all filters
- Watchlist + email alerts (up to 5 facilities)
- Weekly CSV export of your watchlist
Enterprise
Need the full dataset, an API, or a custom feed? That’s a conversation — not a checkout.
- Full-dataset licensing — snapshot or ongoing
- API & bulk access
- Custom feeds, integrations, and SLAs
- Dedicated support